Detail Views
Kiali provides filtered list views of all your service mesh definitions. Each view provides health, details, YAML definitions and links to help you visualize your mesh. There are list and detail views for:
- Applications
- Istio Configuration
- Services
- Workloads
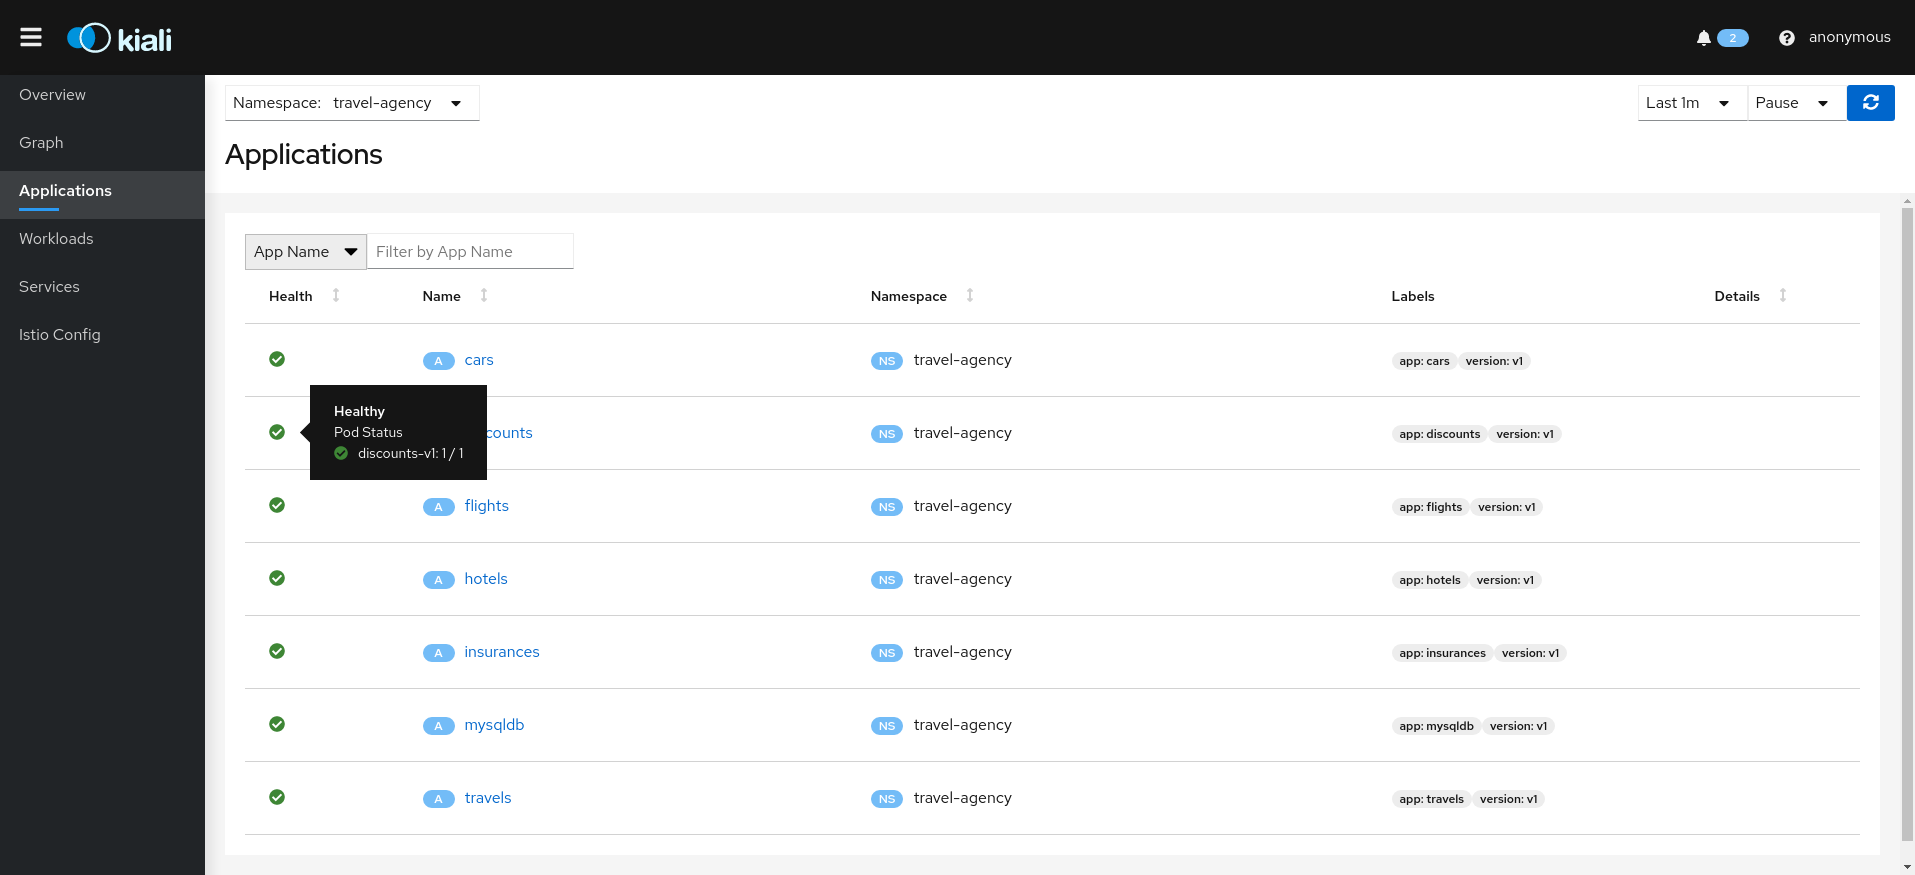
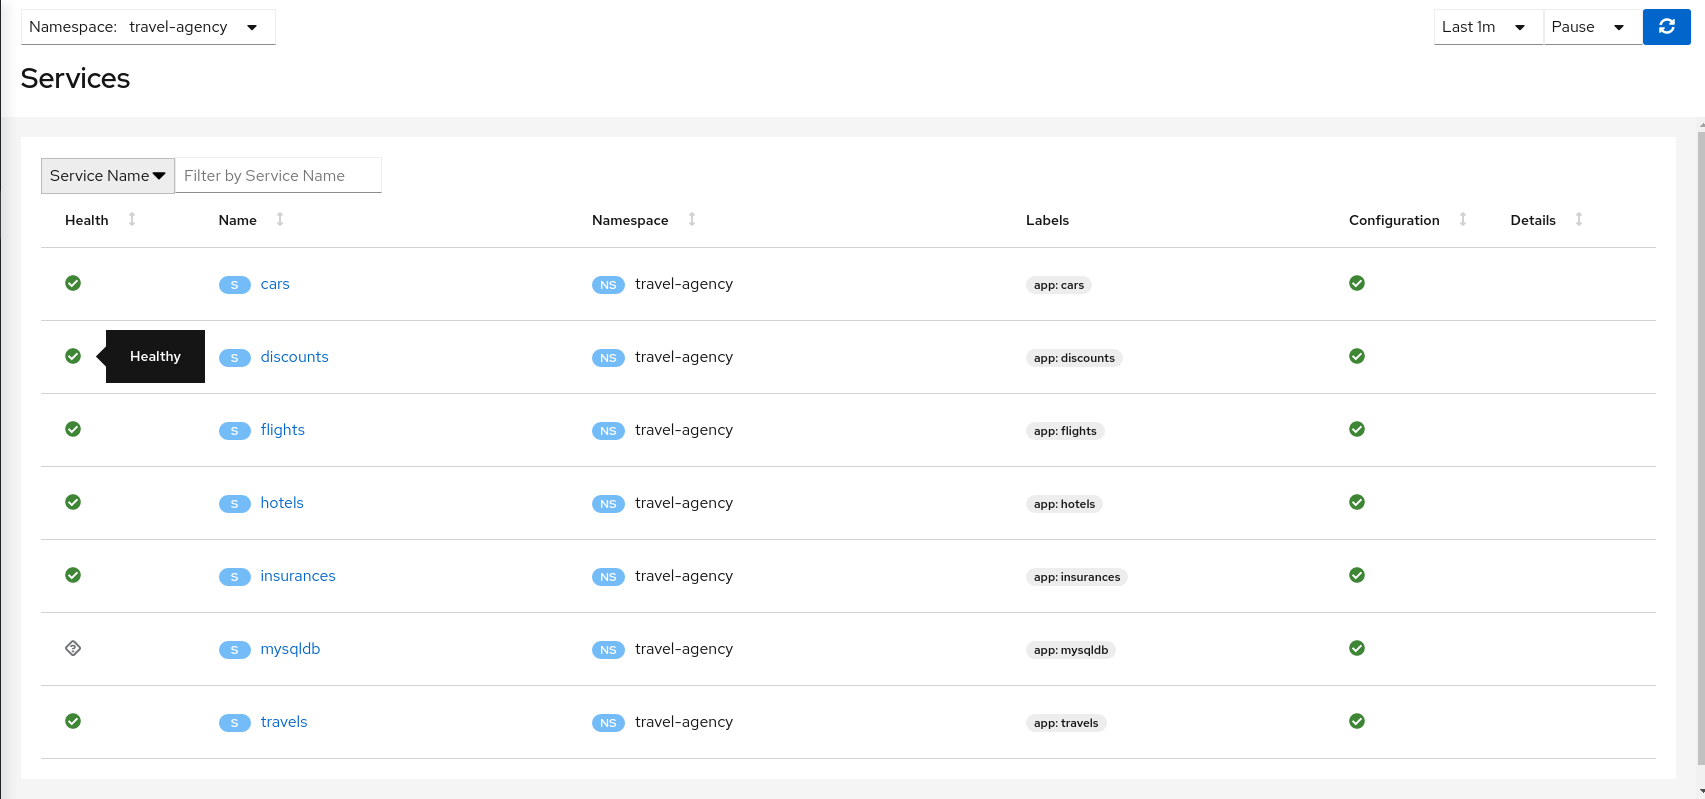
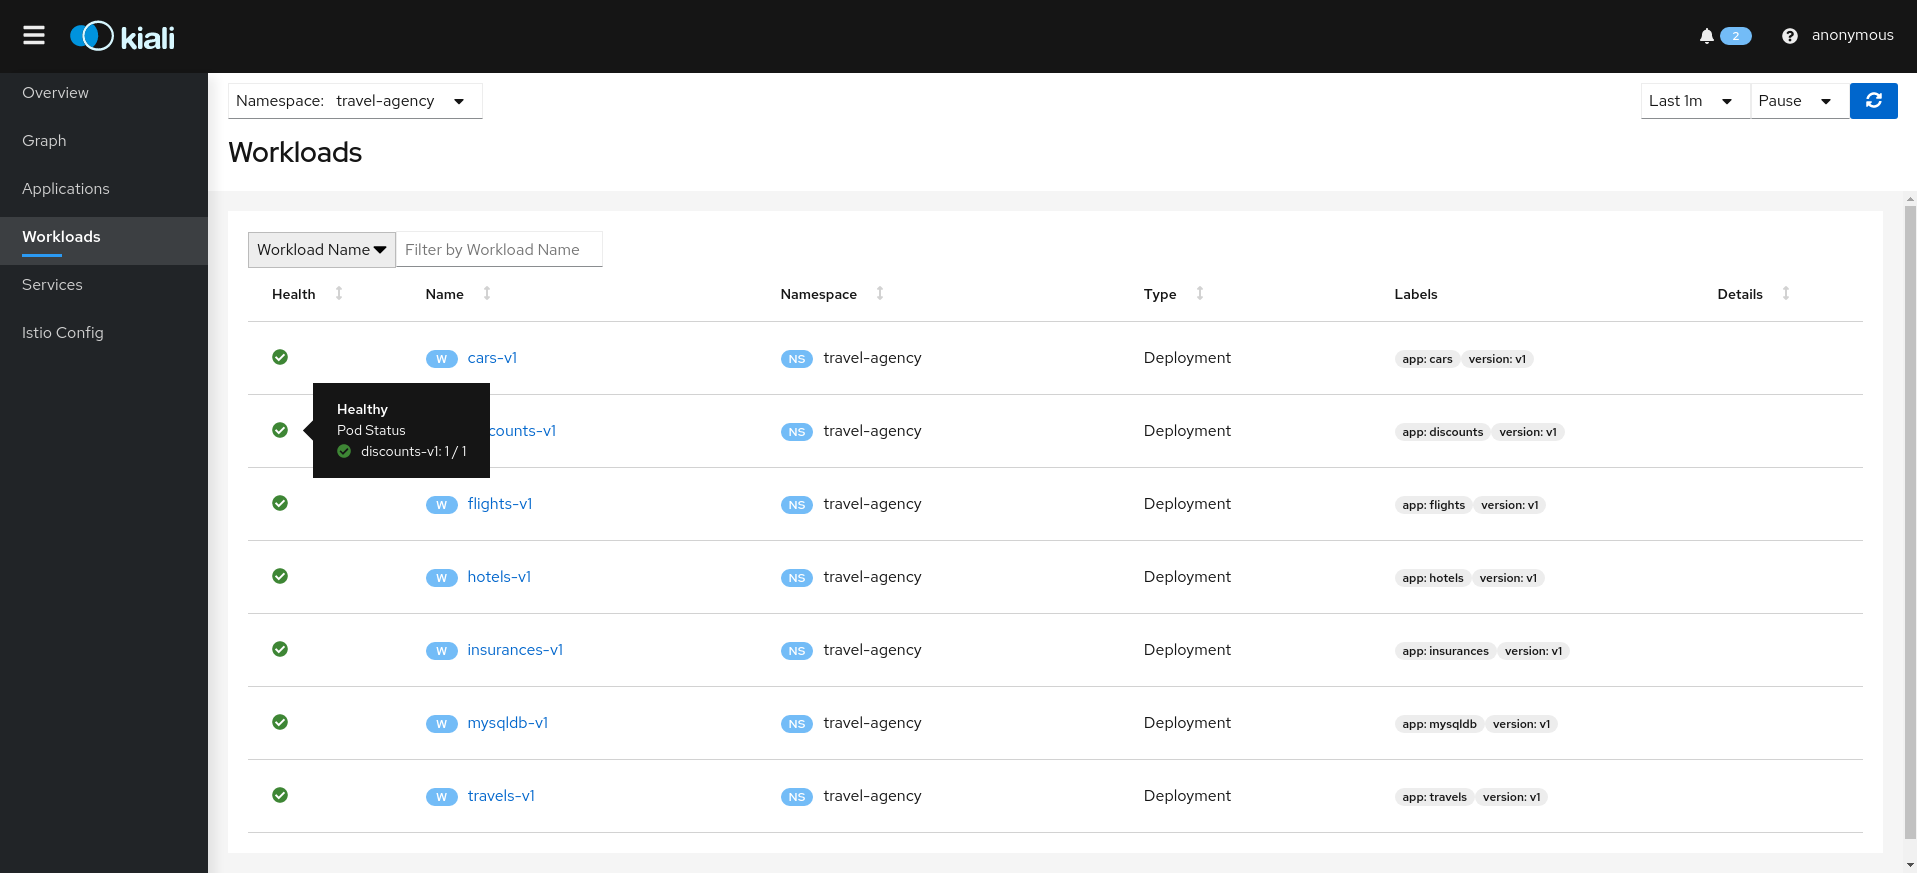
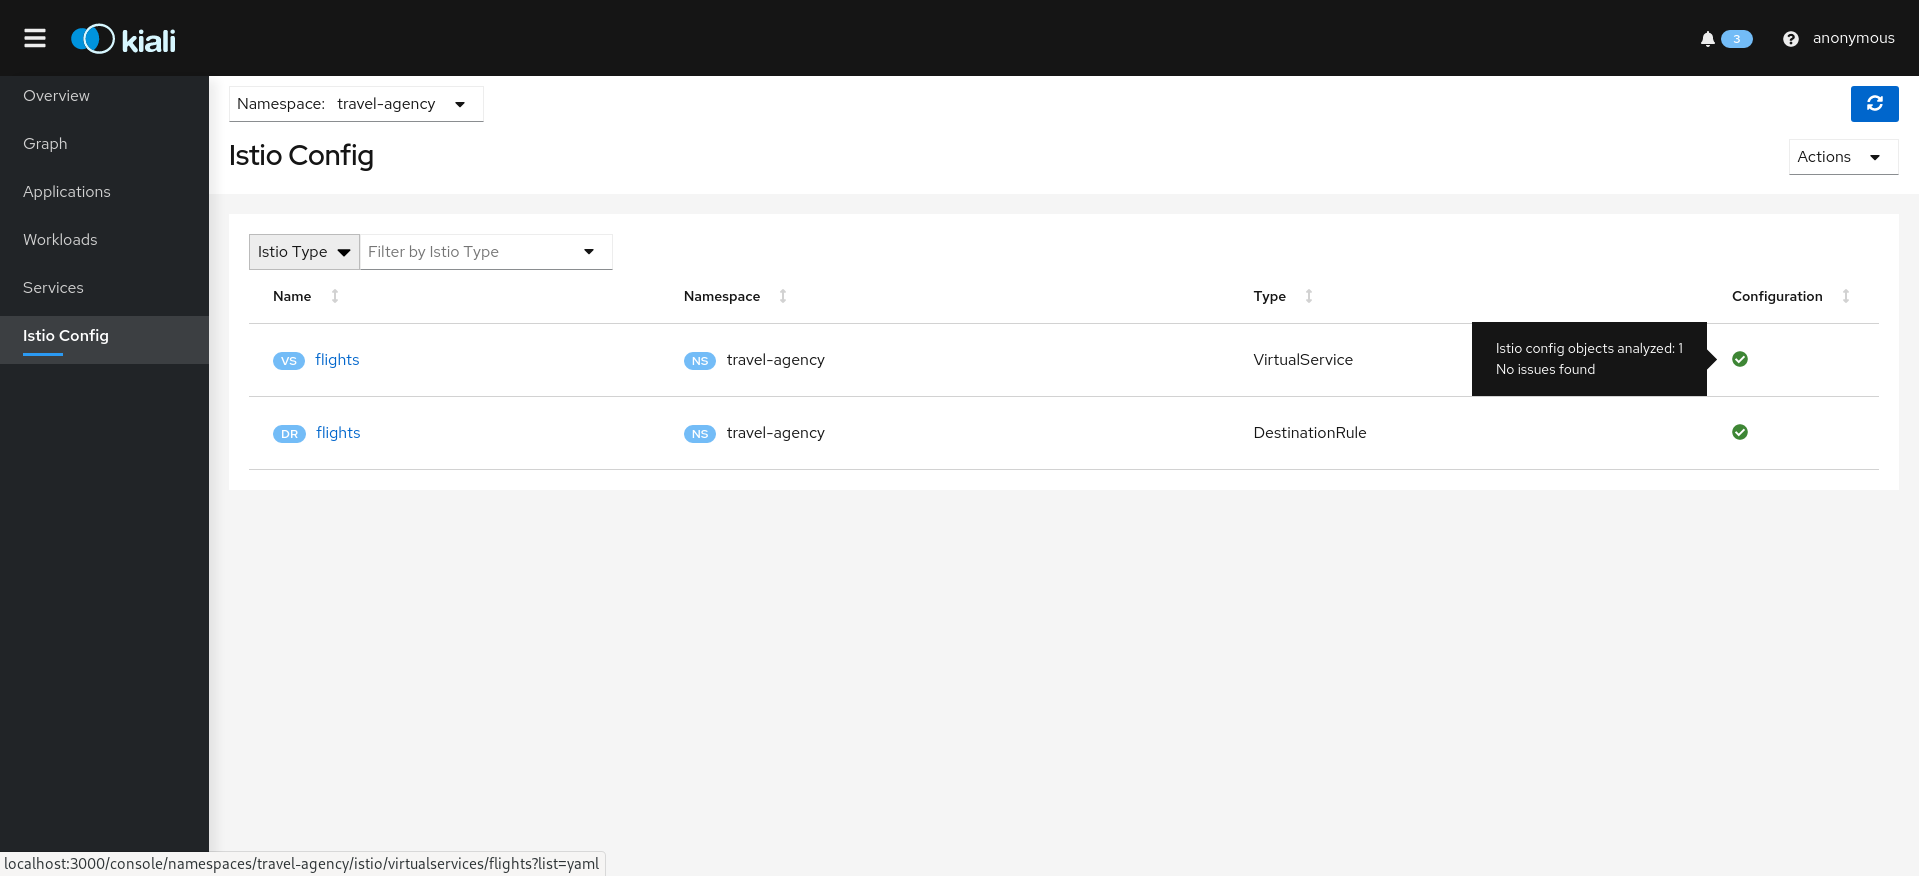
Selecting an object from the list will bring you to its detail page. For Istio Config, Kiali will present its YAML, along with contextual validation information. Other mesh components present a variety of Tabs.
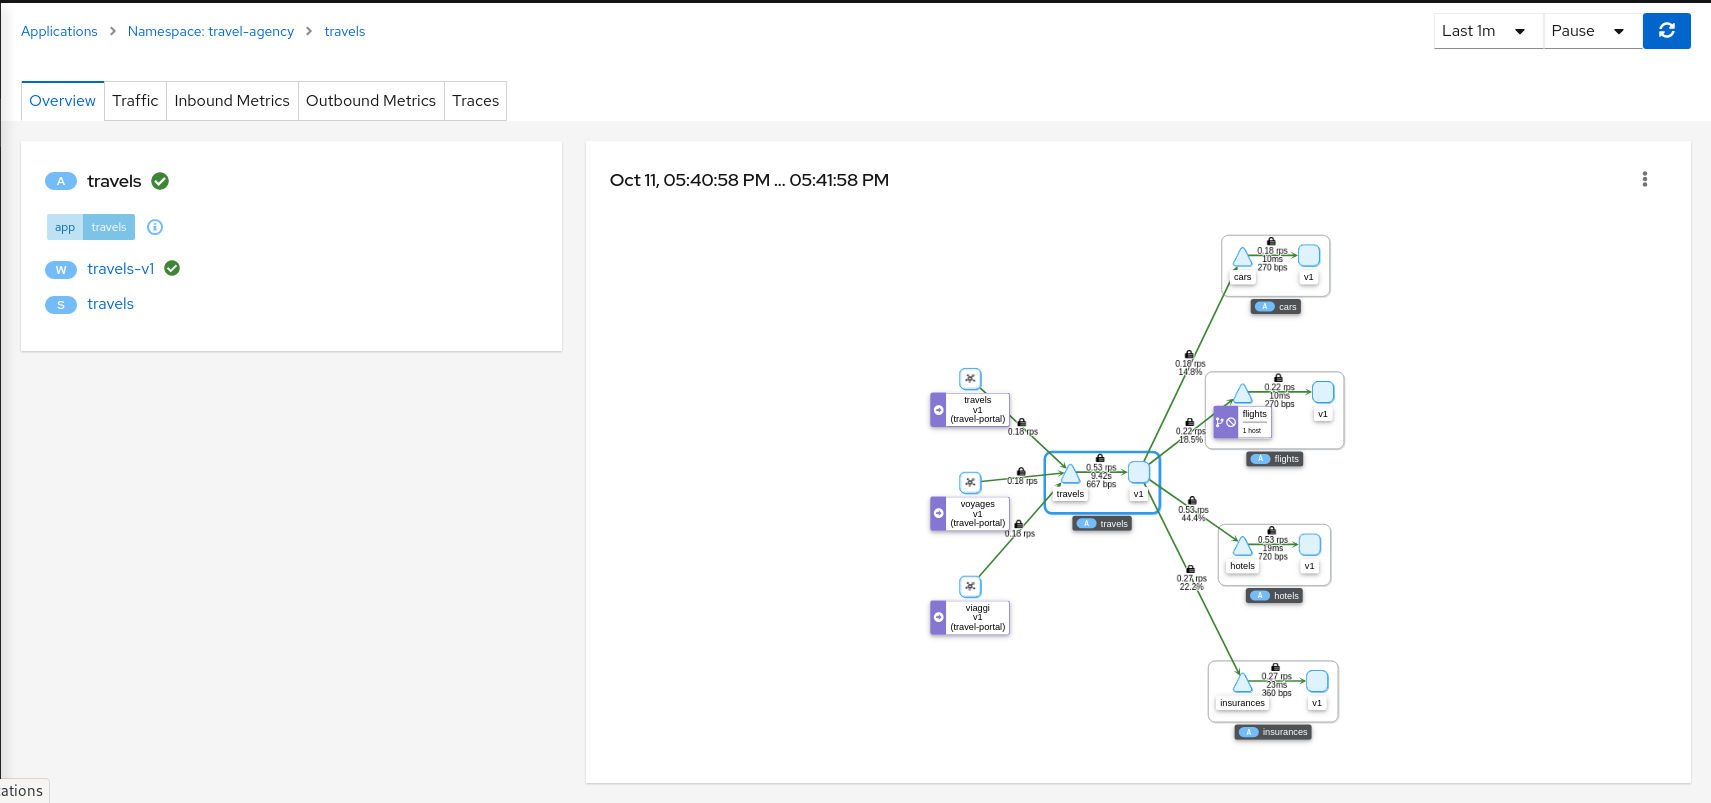
Overview Tab
Overview is the default Tab for any detail page. The overview tab provides detailed information, including health status, and a detailed mini-graph of the current traffic involving the component. The full set of tabs, as well as the detailed information, varies based on the component type.
Each Overview provides:
- links to related components and linked Istio configuration.
- health status.
- validation information.
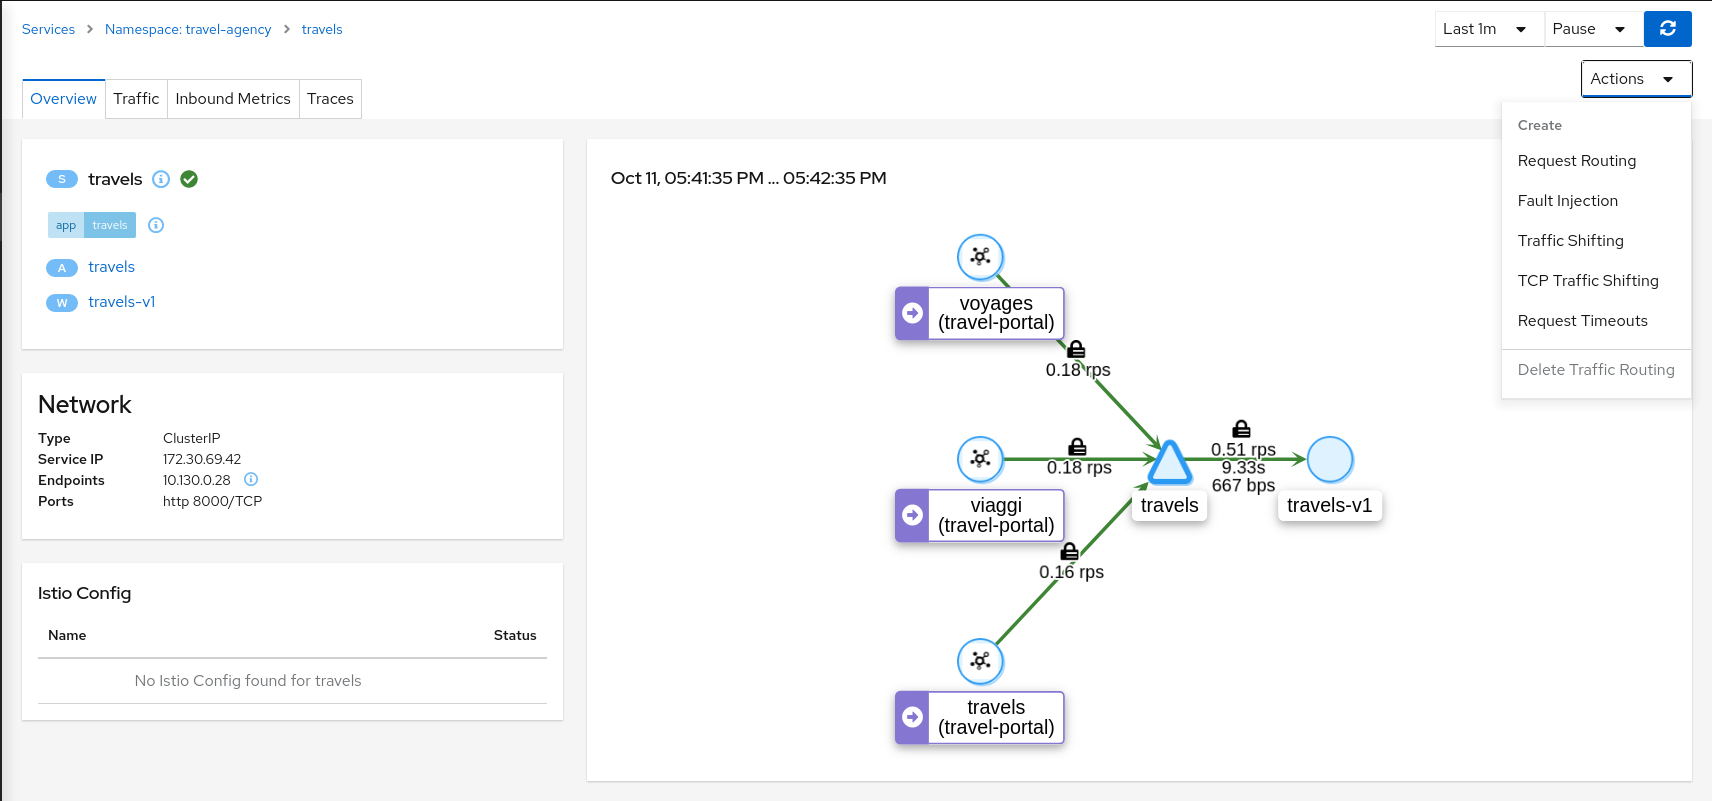
- an Action menu for actions that can be taken on the component.
- several Wizards are available.
And also type-specfic information. For example:
- Service detail includes Network information.
- Workload detail provides backing Pod information.
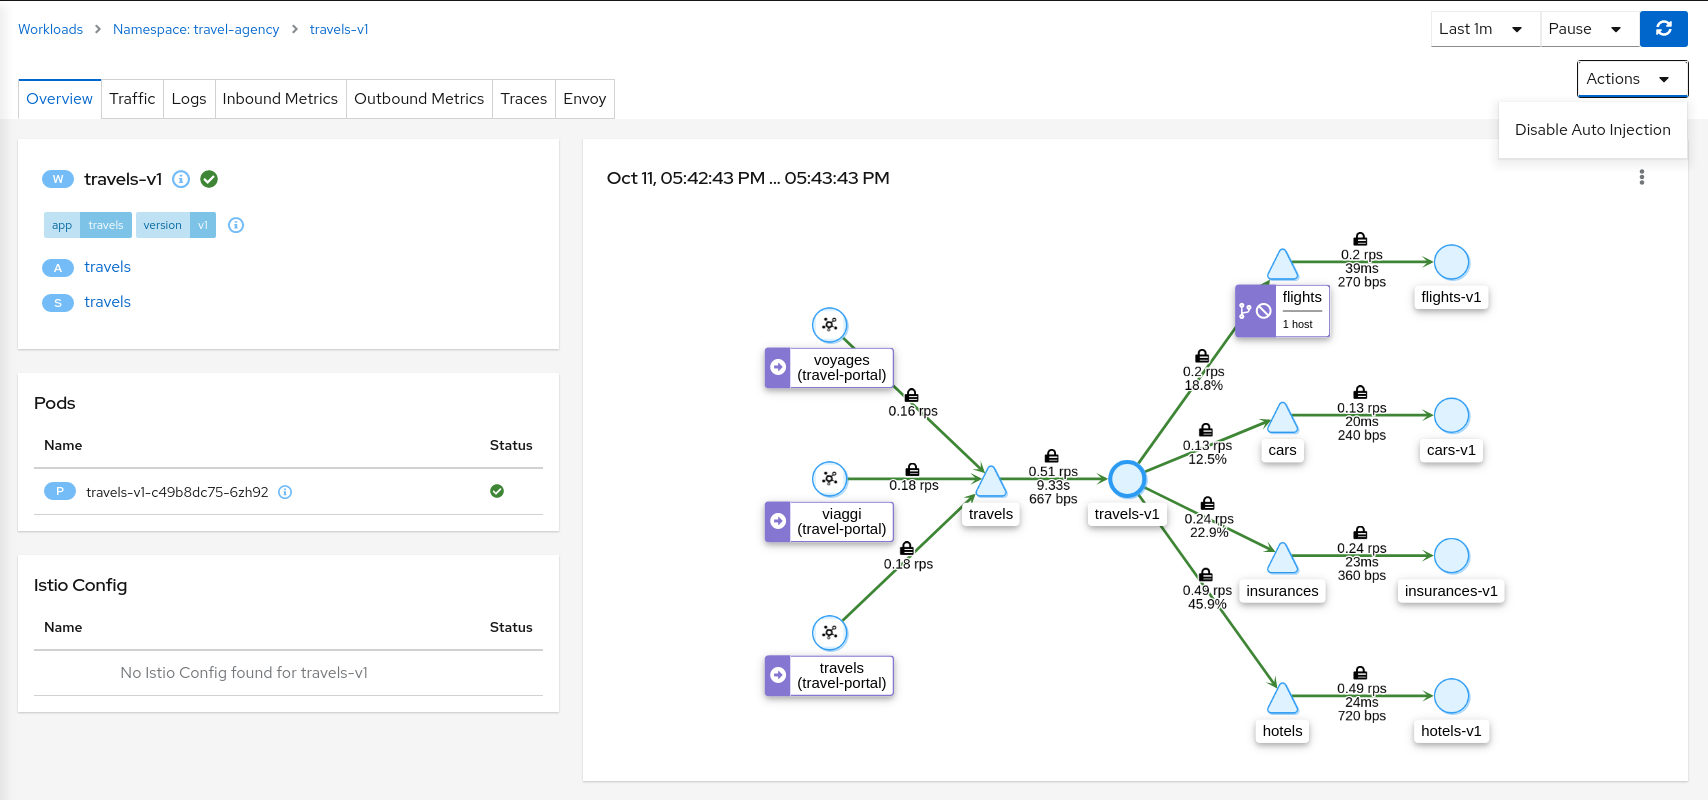
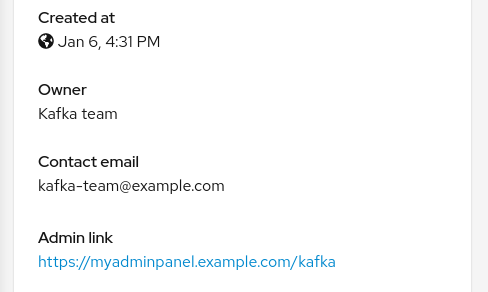
Both Workload and Service detail can be customized to some extent, by adding additional details supplied as annotations. This is done through the additional_display_details field in the Kiali CR.
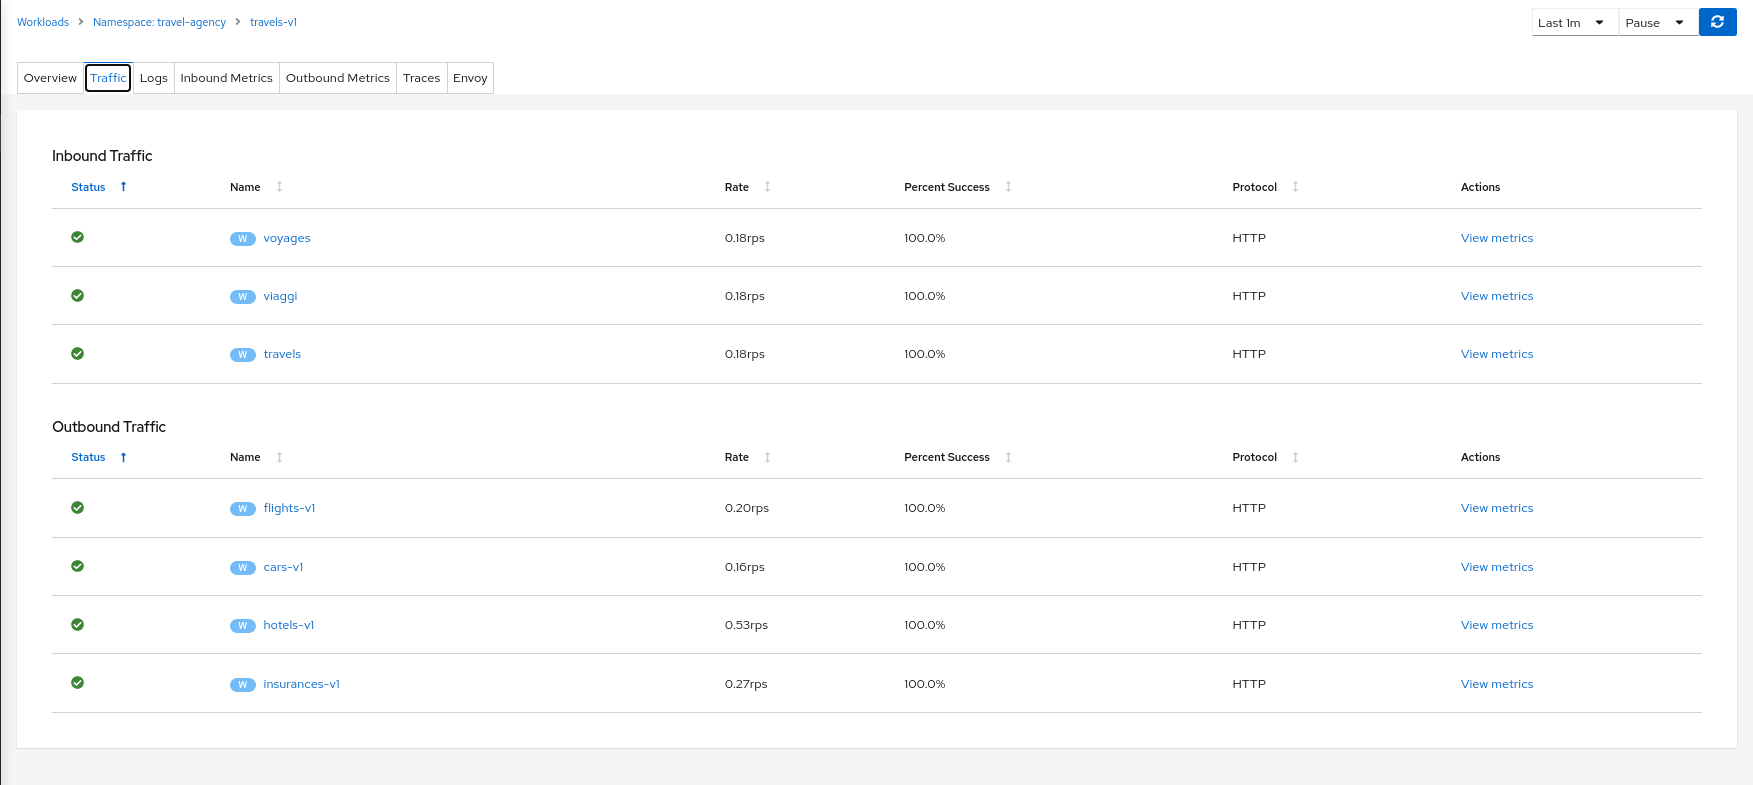
Traffic
The Traffic Tab presents a service, app, or workload’s Inbound and Outbound traffic in a table-oriented way:
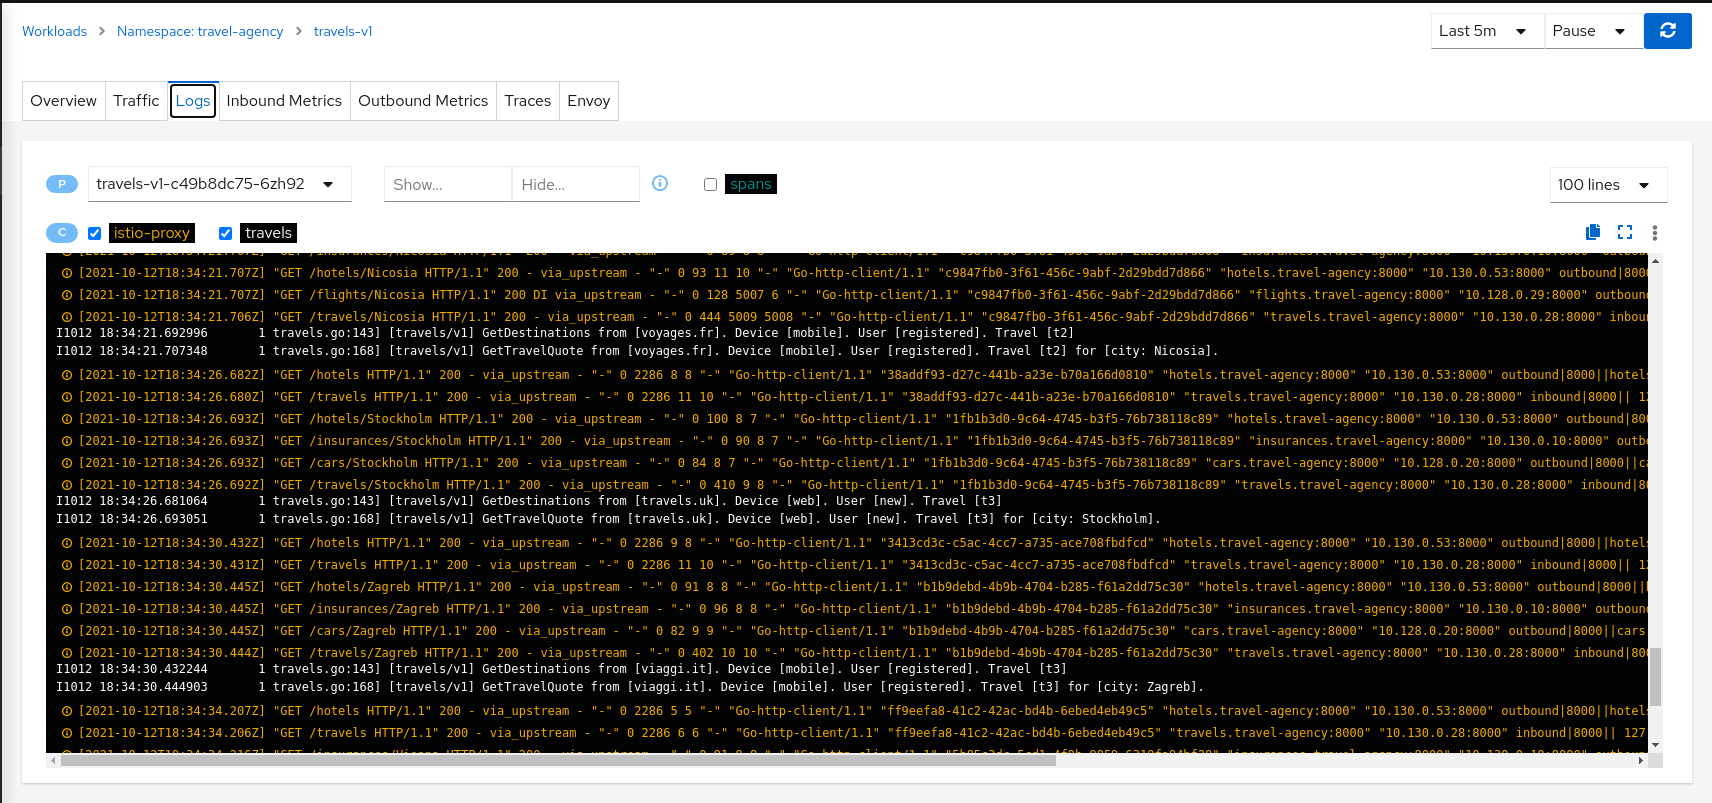
Logs
Workload detail offers a special Logs tab. Kiali offers a special unified logs view that lets users correlate app and proxy logs. It can also add-in trace span information to help identify important traces based on associated logging. More powerful features include substring or regex Show/Hide, full-screen, and the ability to set proxy log level without a pod restart.
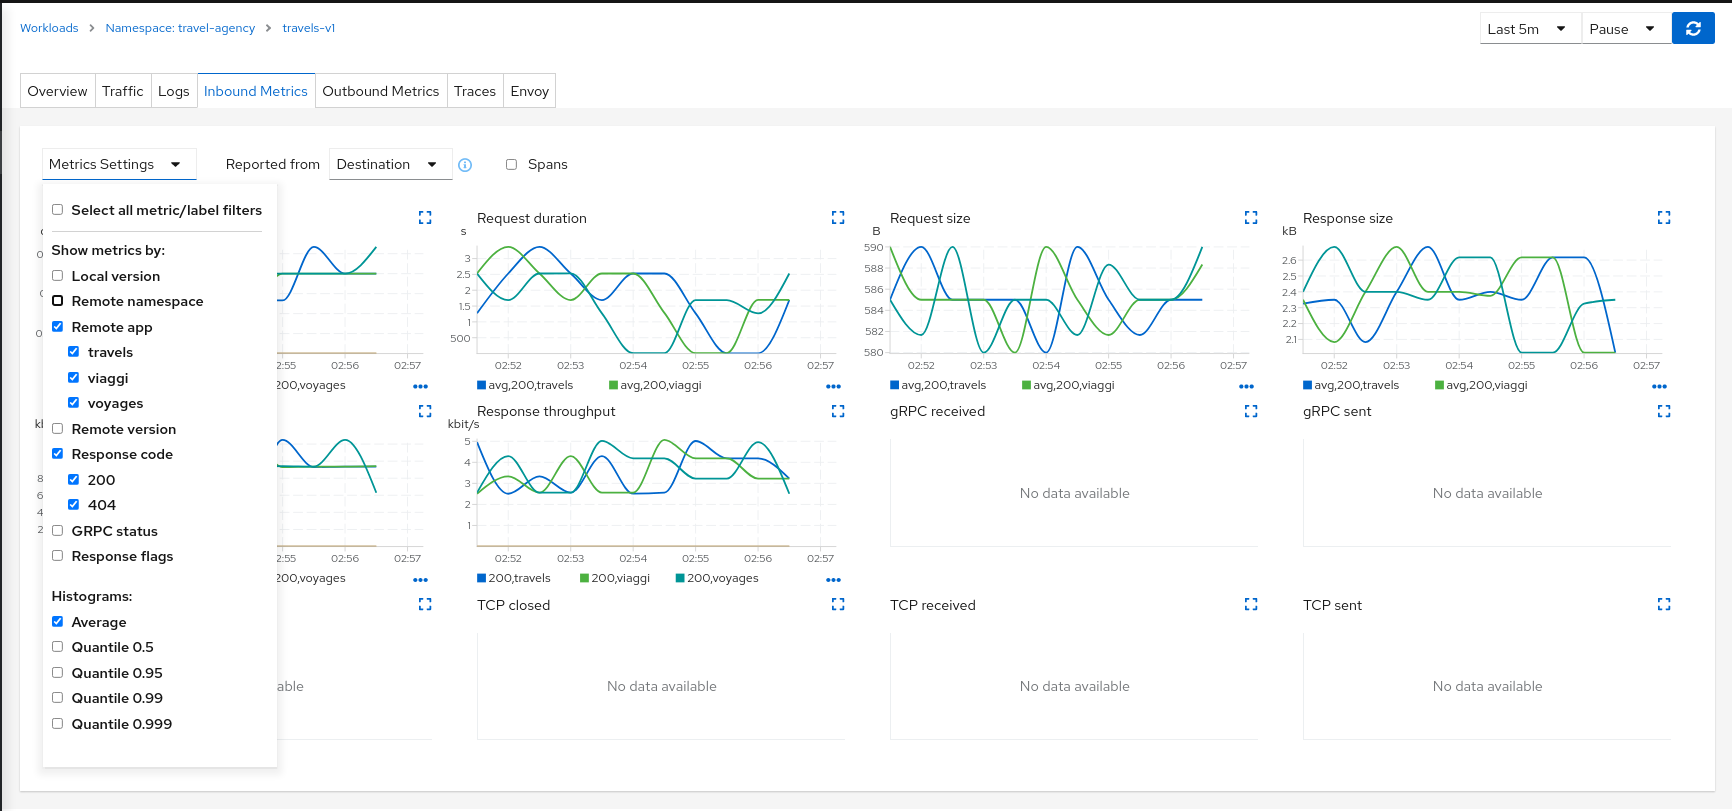
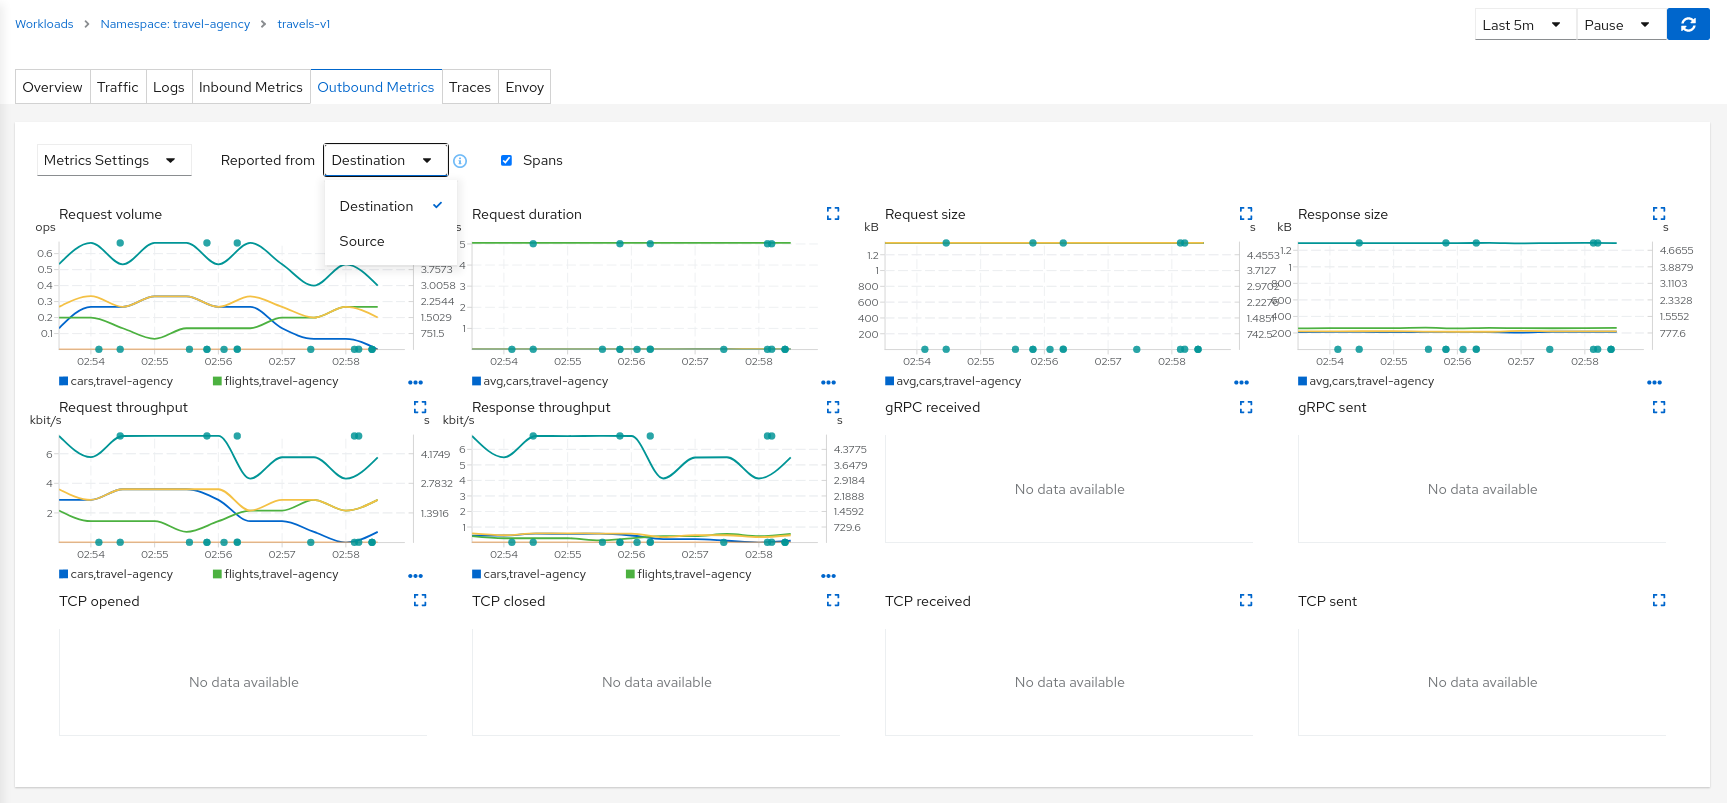
Metrics
Each detail view provides Inbound Metrics and/or Outbound Metrics tabs, offering predefined metric dashboards. The dashboards provided are tailored to the relevant application, workload or service level. Application and workload detail views show request and response metrics such as volume, duration, size, or tcp traffic. The service detail view shows request and response metrics for inbound traffic only.
Kiali allows the user to customize the charts by choosing the charted dimensions. It can also present metrics reported by either source or destination proxy metrics. And for troublshooting it can overlay trace spans.
Traces
Each detail view provides a Traces tab with a native integration with Jaeger. For more, see Tracing.
Dashboards
Kiali will display additional tabs for each applicable Built-In Dashboard or Custom Dashboard.
Built-in dashboards
Kiali comes with built-in dashboards for several runtimes, including Envoy, Go, Node.js, and others.
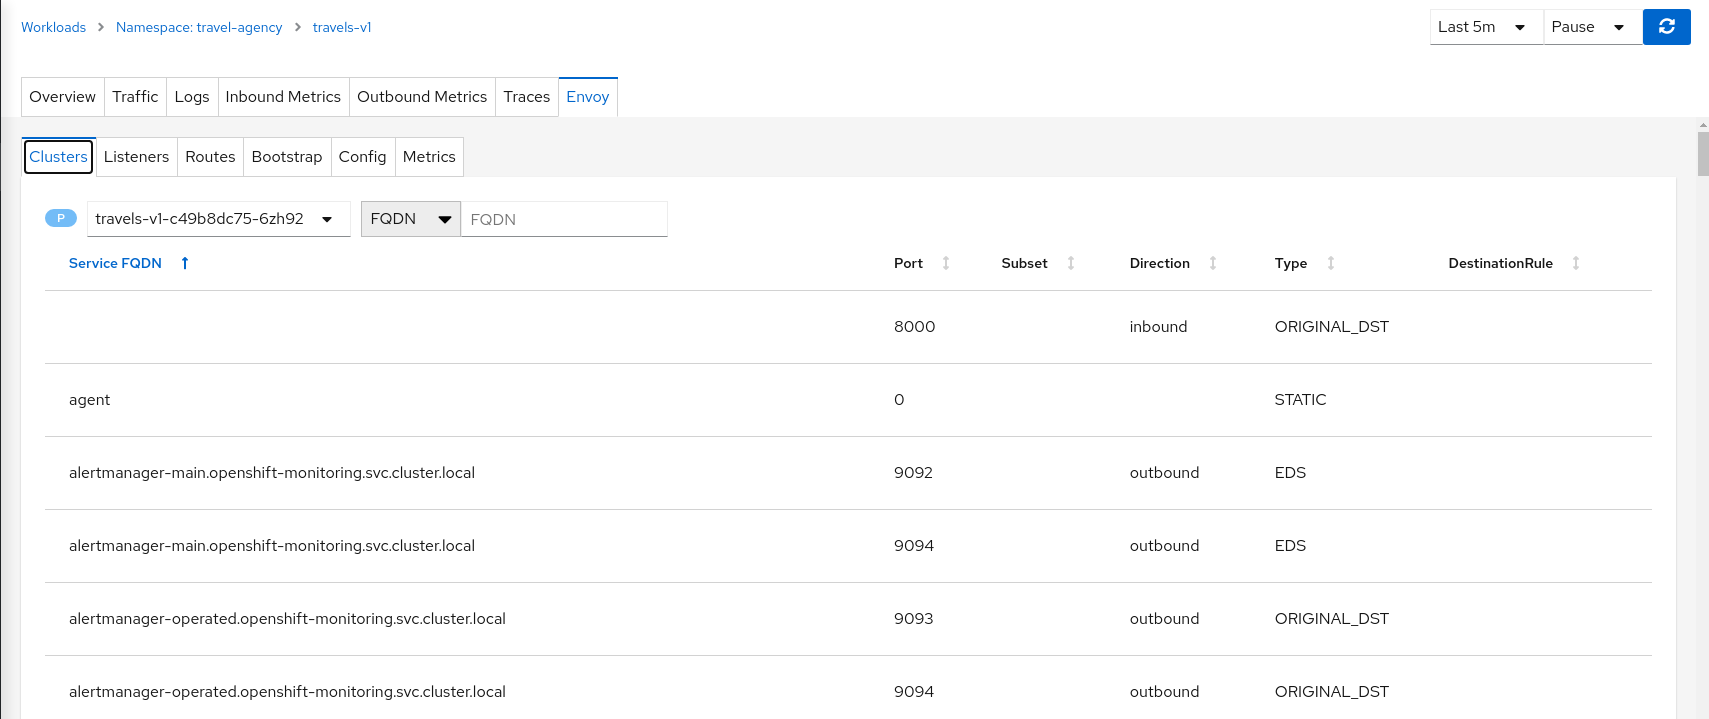
Envoy
The most important built-in dashboard is for Envoy. Kiali offers the Envoy tab for many workloads. The Envoy tab is actually a Built-In Dashboard, but it is very common as it applies to any workload injected with, or that is itself, an Envoy proxy. Being able to inspect the Envoy proxy is invaluable when troublshooting your mesh. The Envoy tab itself offers five subtabs, exposing a wealth of information.
Istio’s Envoy sidecars supply some internal metrics, that can be viewed in Kiali. They are different than the metrics reported by Istio Telemetry, which Kiali uses extensively. Some of Envoy’s metrics may be redundant.
Note that the enabled Envoy metrics can be tuned, as explained in the Istio documentation: it’s possible to get more metrics using the statsInclusionPrefixes annotation. Make sure you include cluster_manager and listener_manager as they are required.
For example, sidecar.istio.io/statsInclusionPrefixes: cluster_manager,listener_manager,listener will add listener metrics for more inbound traffic information. You can then customize the Envoy dashboard of Kiali according to the collected metrics.
Go
Contains metrics such as the number of threads, goroutines, and heap usage. The expected metrics are provided by the Prometheus Go client.
Example to expose built-in Go metrics:
        http.Handle("/metrics", promhttp.Handler())
        http.ListenAndServe(":2112", nil)
As an example and for self-monitoring purpose Kiali itself exposes Go metrics.
The pod annotation for Kiali is: kiali.io/dashboards: go
Node.js
Contains metrics such as active handles, event loop lag, and heap usage. The expected metrics are provided by prom-client.
Example of Node.js metrics for Prometheus:
const client = require('prom-client');
client.collectDefaultMetrics();
// ...
app.get('/metrics', (request, response) => {
  response.set('Content-Type', client.register.contentType);
  response.send(client.register.metrics());
});
Full working example: https://github.com/jotak/bookinfo-runtimes/tree/master/ratings
The pod annotation for Kiali is: kiali.io/dashboards: nodejs
Quarkus
Contains JVM-related, GC usage metrics. The expected metrics can be provided by SmallRye Metrics, a MicroProfile Metrics implementation. Example with maven:
    <dependency>
      <groupId>io.quarkus</groupId>
      <artifactId>quarkus-smallrye-metrics</artifactId>
    </dependency>
The pod annotation for Kiali is: kiali.io/dashboards: quarkus
Spring Boot
Three dashboards are provided: one for JVM memory / threads, another for JVM buffer pools and the last one for Tomcat metrics. The expected metrics come from Spring Boot Actuator for Prometheus. Example with maven:
    <dependency>
      <groupId>org.springframework.boot</groupId>
      <artifactId>spring-boot-starter-actuator</artifactId>
    </dependency>
    <dependency>
      <groupId>io.micrometer</groupId>
      <artifactId>micrometer-core</artifactId>
    </dependency>
    <dependency>
      <groupId>io.micrometer</groupId>
      <artifactId>micrometer-registry-prometheus</artifactId>
    </dependency>
Full working example: https://github.com/jotak/bookinfo-runtimes/tree/master/details
The pod annotation for Kiali with the full list of dashboards is: kiali.io/dashboards: springboot-jvm,springboot-jvm-pool,springboot-tomcat
By default, the metrics are exposed on path /actuator/prometheus, so it must be specified in the corresponding annotation: prometheus.io/path: "/actuator/prometheus"
Thorntail
Contains mostly JVM-related metrics such as loaded classes count, memory usage, etc. The expected metrics are provided by the MicroProfile Metrics module. Example with maven:
    <dependency>
      <groupId>io.thorntail</groupId>
      <artifactId>microprofile-metrics</artifactId>
    </dependency>
Full working example: https://github.com/jotak/bookinfo-runtimes/tree/master/productpage
The pod annotation for Kiali is: kiali.io/dashboards: thorntail
Vert.x
Several dashboards are provided, related to different components in Vert.x: HTTP client/server metrics, Net client/server metrics, Pools usage, Eventbus metrics and JVM. The expected metrics are provided by the vertx-micrometer-metrics module. Example with maven:
    <dependency>
      <groupId>io.vertx</groupId>
      <artifactId>vertx-micrometer-metrics</artifactId>
    </dependency>
    <dependency>
      <groupId>io.micrometer</groupId>
      <artifactId>micrometer-registry-prometheus</artifactId>
    </dependency>
Init example of Vert.x metrics, starting a dedicated server (other options are possible):
      VertxOptions opts = new VertxOptions().setMetricsOptions(new MicrometerMetricsOptions()
          .setPrometheusOptions(new VertxPrometheusOptions()
              .setStartEmbeddedServer(true)
              .setEmbeddedServerOptions(new HttpServerOptions().setPort(9090))
              .setPublishQuantiles(true)
              .setEnabled(true))
          .setEnabled(true));
Full working example: https://github.com/jotak/bookinfo-runtimes/tree/master/reviews
The pod annotation for Kiali with the full list of dashboards is: kiali.io/dashboards: vertx-client,vertx-server,vertx-eventbus,vertx-pool,vertx-jvm
Custom Dashboards
When the built-in dashboards don’t offer what you need, it’s possible to create your own. See Custom Dashboard Configuration for more information.